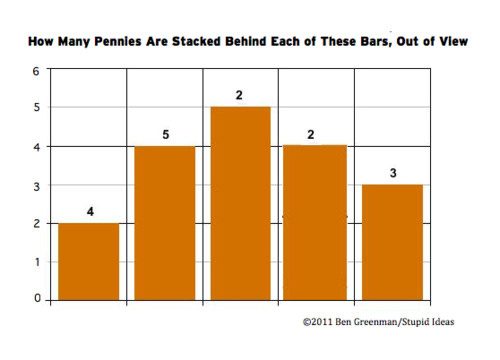
Essayist and author Ben Greenman claims to not like charts, which is perhaps why he has created a slew of wonderful absurdist charts like the one above. The original goal of the chart-making that Greenman undertook was to understand the fictional character he was creating, who has the dubious job of being a “chart artist” or “chartist.” He writes:
For this new book and the chart artist in it, I started to make charts. The first one I thought of, though not the first one I made, was “How Well You Understand This Graph Over Time.” It seemed like the perfect self-annihilating thing, capable of both making people laugh and making them furious. This is the graph that started it all, in a sense. I have had it in my head for years. The character in my book has made this graph at some point, and it gets him thinking about what graphs really are. I think this graph has a tremendous amount to teach us, and also nothing to say.
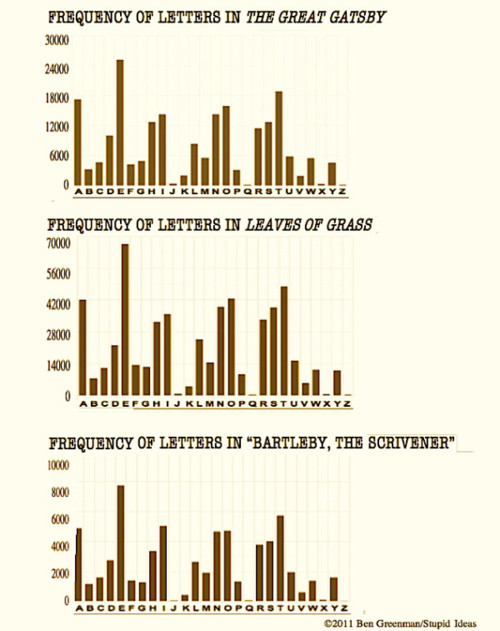
Read on after the break for more of Greenman’s chartart, which include vital information such as the letter distribution in The Great Gatsby, and how many pennies are hidden behind a particular bar graph.


(I Love Charts via Neatorama)


Published: May 13, 2011 11:00 am