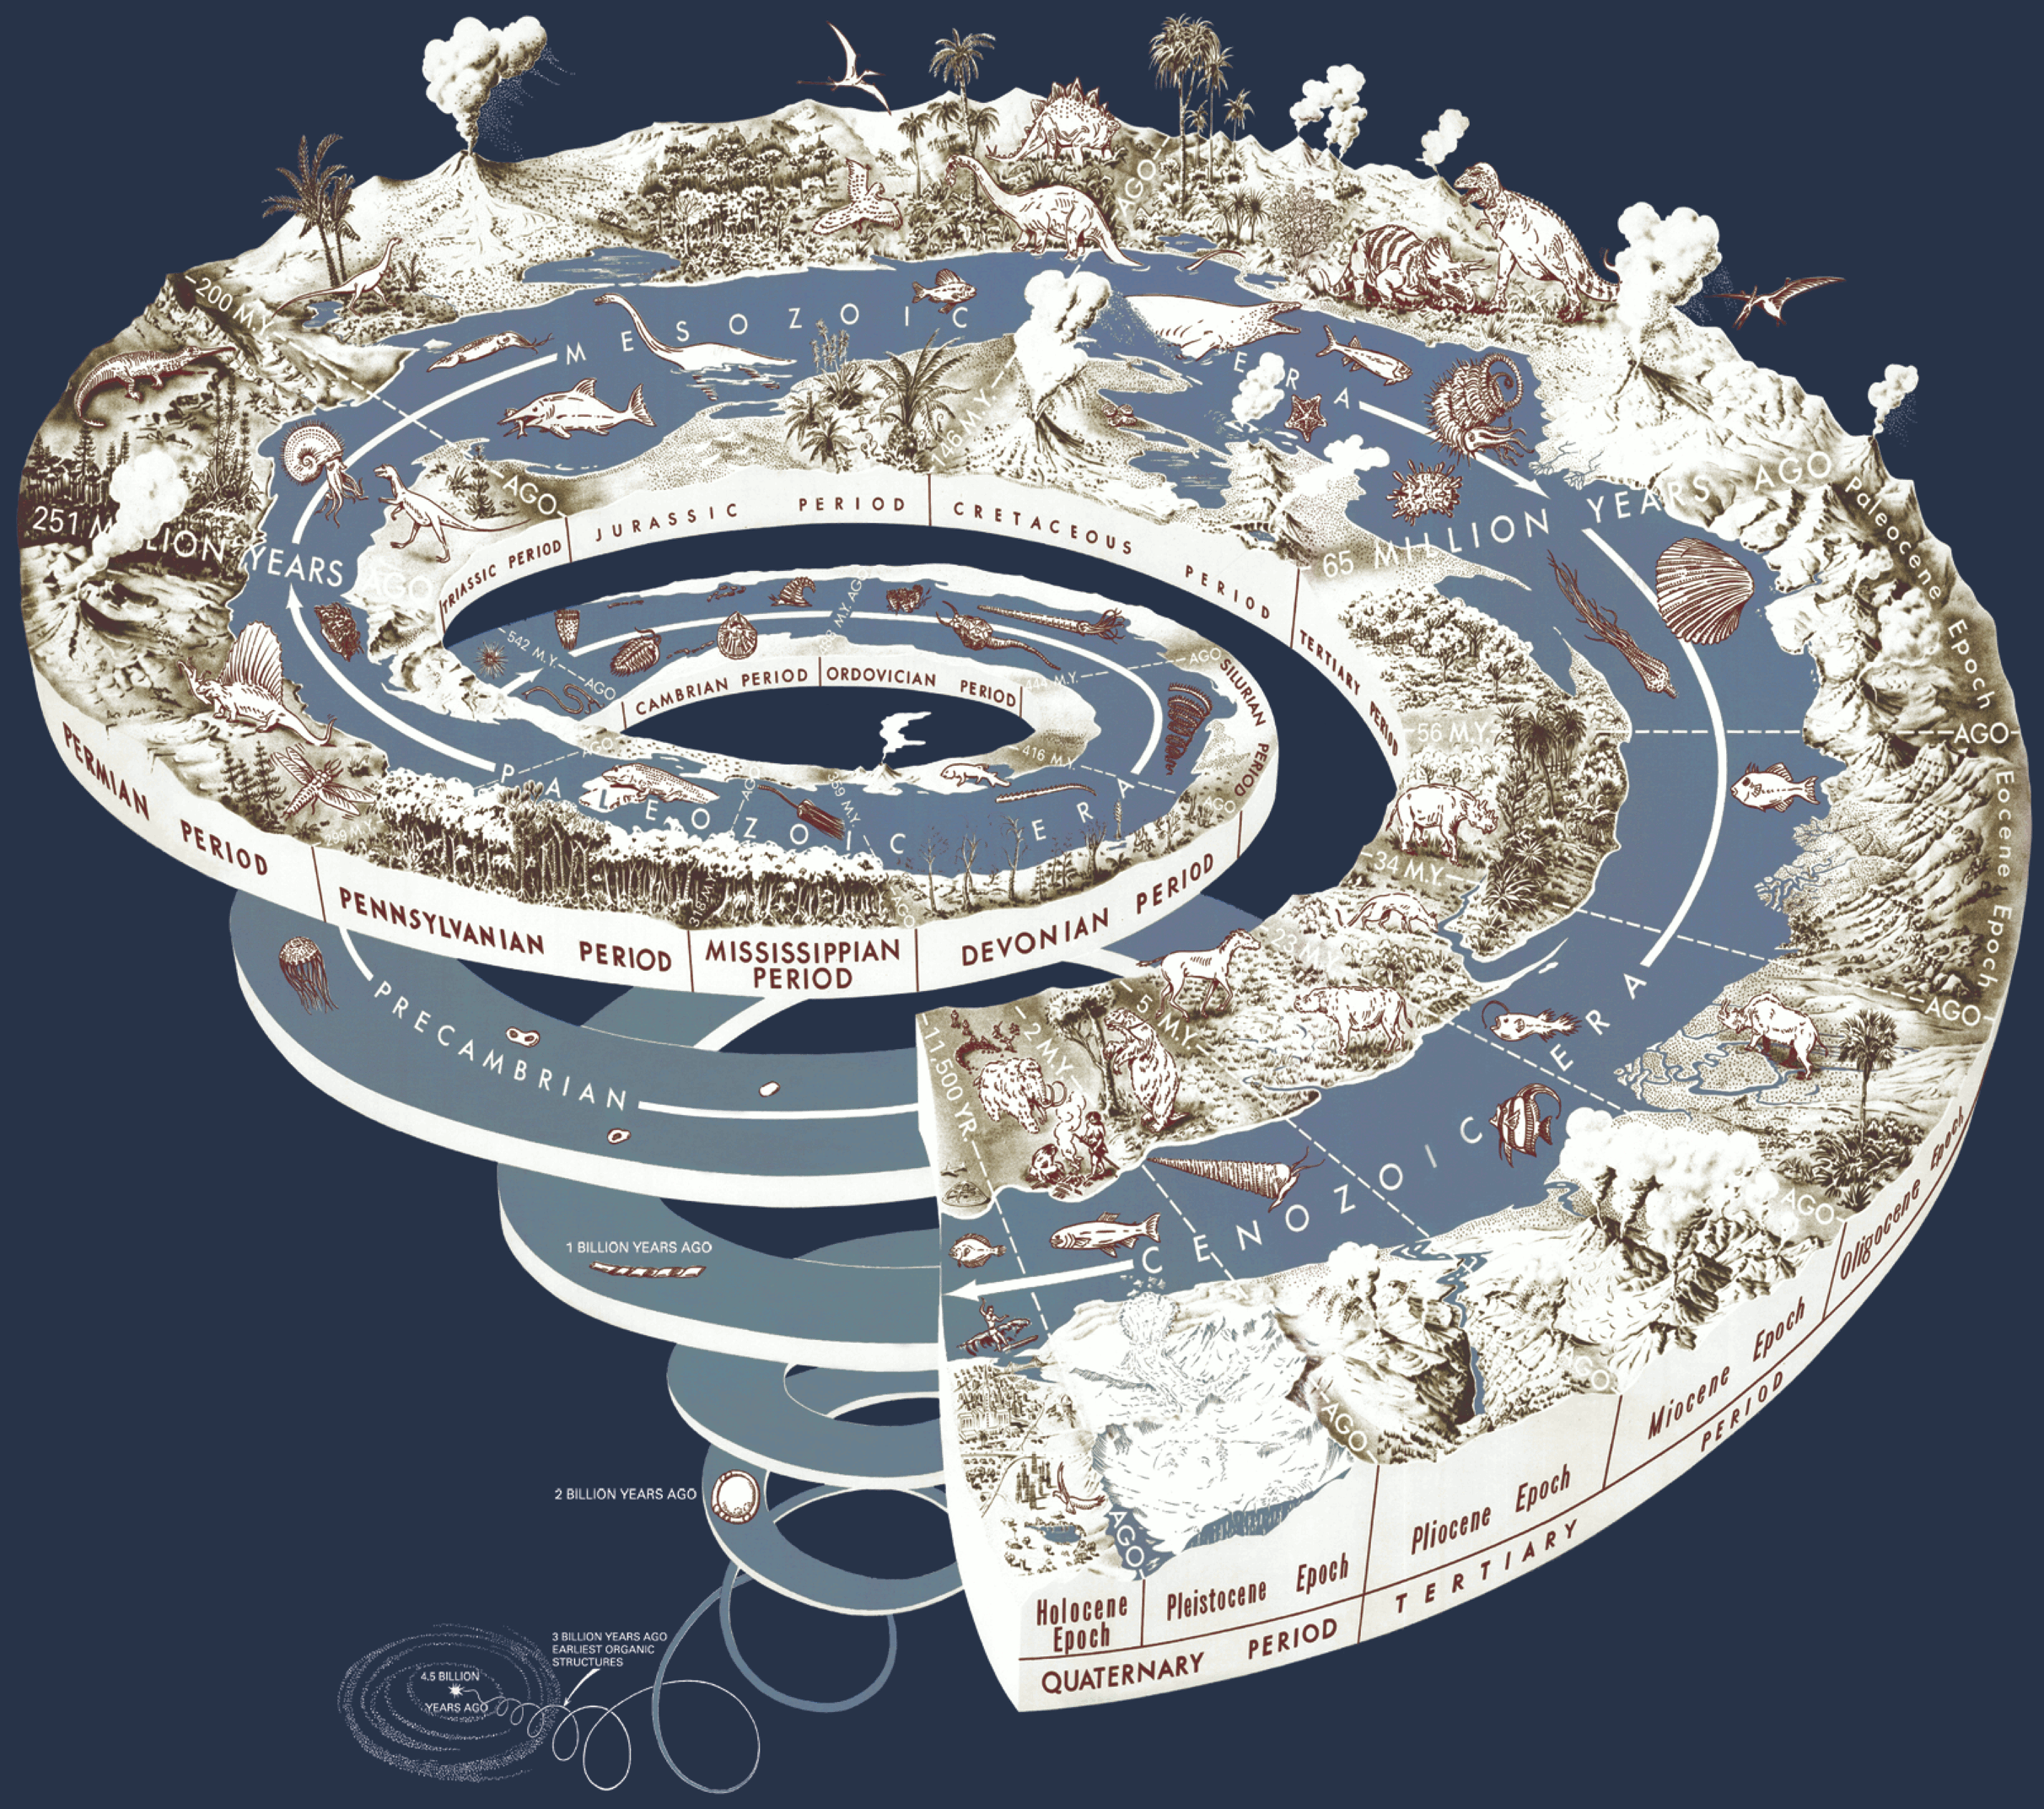
Your Scientific Chart Porn For The Day: A Spiralling Geological Timeline Of Earth’s 4.5 Billion Years
Wibbly wobbly timey wimey!

Time is an illusion. Lunch time, doubly so. The timeline of our planet’s 4.5 billion year geological history? Well you can just forget about making sense of that yourself, good sirs. What you need is a giant, elaborately detailed chart for that sort of thing.
This chart comes to us by way of the U.S. Geological Survey, a government organization which provides valuable and impartial data on the ecosystems, biology, and geology of the country, and was designed in 2008 by Joseph Graham, William Newman, and John Stacey. There’s a lot to take in here, but my favorite part has to be this little segment of the Triassic Period where it looks like a dinosaur is having a nice friendly chat with what I believe to be a giant Ammonite:
“Why good morning, fellow non-mammalian life form! What a lovely day it is today!” “Yes, we will probably rule this land for a good many trillions of years to come and nothing terrible will ever happen to our ancestors!”
You can get up close to the action by checking out the full PDF on the UGSG website.
(via io9, image via USGS)
Are you following The Mary Sue on Twitter, Facebook, Tumblr, Pinterest, & Google +?
Have a tip we should know? tips@themarysue.com