And that blogger was me! After a good few months’ worth of watching Doctor Who, reading Doctor Who scripts, talking to other people about their thoughts on Doctor Who, getting briefly sick of Doctor Who, watching more Doctor Who, and doing a tremendous amount of copypasting things into other things, here’s what happened.
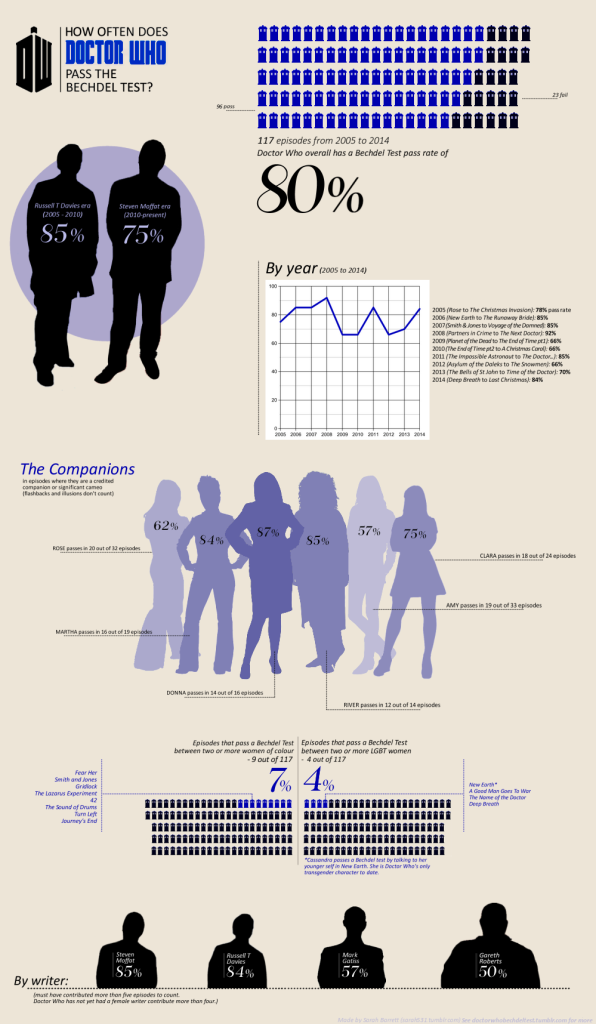
Turns out that out of 117 episodes, 96 pass the Bechdel Test, giving Doctor Who an overall pass rate of… 80%! That strikes me as not bad, but not outstanding either, for a show that has so many female main characters. I give you a B+, Doctor Who. I know you can do better. Especially since:
The percentage of Bechdel Test passes between women of colour is low. 7%, and that’s really only because we had Martha as a main character, having conversations with her family and friends, for so long. The percentage of Bechdel Test passes between LGBT women is even lower – a mere 3%, and that’s almost entirely down to the existence of Madame Vastra and Jenny. The percentage of Bechdel Test passes between disabled women is lowest of all – 0% in fact – but I kinda expected that.
But I promised you some mild surprises, so here’s mild surprise number one: the Steven Moffat factor. The current Doctor Who showrunner receives a hell of a lot of criticism and often it’s deserved, but his series isn’t that far behind Davies’s series in terms of Bechdel Test passes. Davies’ series (1-4 plus specials) stand tall at 85%, but Moffat’s series (5-8) score 75%. Mild surprise number two: Steven Moffat actually wrote the most Bechdel Test-passing episodes. Not by much – only two more than Davies – but whaddayaknow.
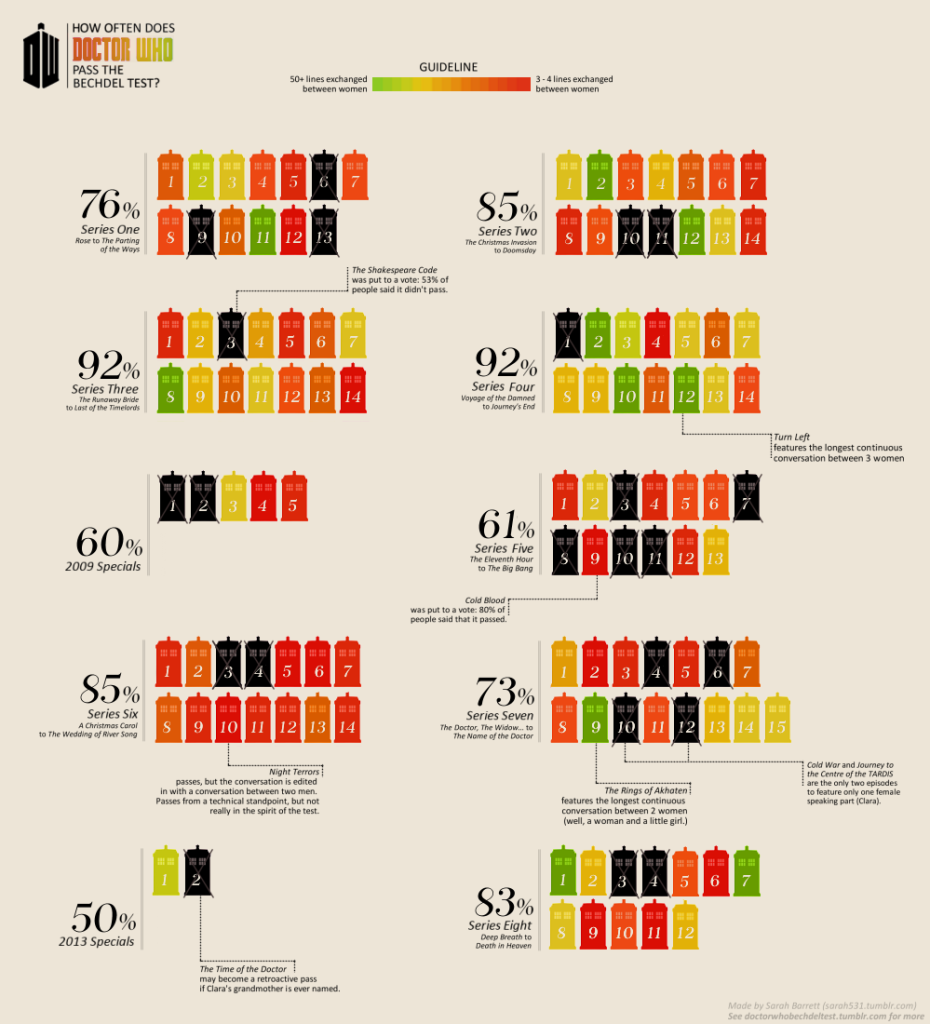
Mild surprise number three (and the nicest of them) is that when these results were published on Doctor Who TV, the response was pretty positive, way more than I expected. Actually, the response has been great everywhere – when I started this I specifically asked for input, and I got plenty. People showed me conversations I’d missed, pointed out miscalculations, voted on which “dubious passes” should be counted and which ones shouldn’t* – I like to think it ended up as democratic a process as it possibly could be. (You can view a list of contributors, as well as a whole lotta other stuff, at this project’s tumblr.)
Anyway, let’s drop the actual end result on ya. Infographic number one details the data per series, per writer, per showrunner and per companion. Infographic number two details the data per episode, and is colour-coded for your convenience. Hooray! Maybe you too will be surprised.
*Does a woman upgraded to a Cyberman still count as a female character? What if her emotions have also been erased? Is the human soul indomitable enough to remain intact inside of a robot body? Are these questions sliiiiightly outside the scope of this study? Well, lemme know.
Sarah Barrett is a blogger, writer, and hopeless geek who got into fandom at age twelve and never quite returned to the real world. She lives, works, and writes on Tumblr.
Are you following The Mary Sue on Twitter, Facebook, Tumblr, Pinterest, & Google +?


Published: Mar 9, 2015 02:50 pm